배치와 연결 (4) - 가장 짧은 연결을 갖도록 배치하기
이전 페이지에서 네 개의 상자를 연결하고 시각화하는 방법에 대해 소개했습니다.
이번에는 가장 짧은 거리를 갖도록 배치하고 연결하는 과정에 대해 소개합니다.
가장 짧은 연결을 갖도록 배치하기
import matplotlib.pyplot as plt
import matplotlib.patches as patches
import numpy as np
def draw_rect(canvas, rectangle):
(x, y, w, h) = rectangle
canvas[y:y+h, x:x+w] = len(rect_info)
def find_place(canvas, rectangle):
w_rect, h_rect = rectangle[2], rectangle[3]
options = []
for i in range(height - h_rect + 1):
for j in range(width - w_rect + 1):
if not np.any(canvas[i:i+h_rect, j:j+w_rect]):
options.append((j, i))
rand = np.random.randint(len(options))
return options[rand]
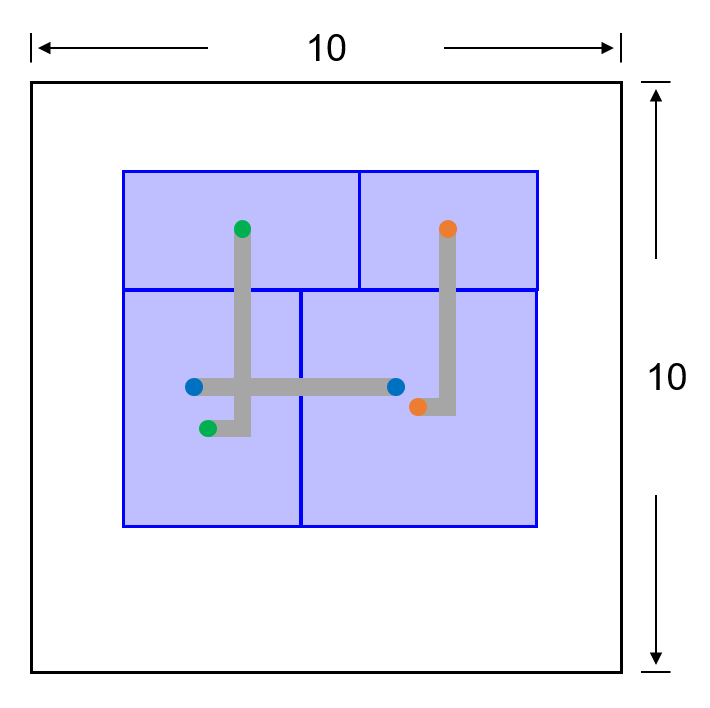
width, height = 10, 10
new_rect = [[0, 0, 4, 4], [0, 0, 3, 4], [0, 0, 4, 2], [0, 0, 3, 2]]
net_info = [(0, 1), (0, 3), (1, 2)]
record_len_route = 100
record_rect_info = []
num_episodes = 1000
for n in range(num_episodes):
canvas1 = np.zeros((height, width))
rect_info = []
for rect in new_rect:
rect[0], rect[1] = find_place(canvas1, rect)
rect_info.append(tuple(rect))
draw_rect(canvas1, rect)
## Record Min(Routing)
len_route = 0
for net in net_info:
x1, y1, w1, h1 = rect_info[net[0]]
x2, y2, w2, h2 = rect_info[net[1]]
len_route += abs(x1 - x2) + abs(y1 - y2)
if len_route < record_len_route:
record_len_route = len_route
record_rect_info = rect_info
print('Episode:', n, ', Record:', len_route)
plt.style.use('default')
plt.rcParams['figure.figsize'] = (6, 6)
plt.rcParams['font.size'] = 12
fig, ax = plt.subplots()
for (x, y, w, h) in record_rect_info:
ax.add_patch(
patches.Rectangle(
(x, y), w, h,
edgecolor='royalblue', facecolor='lightsteelblue',
linewidth=0.5, fill=True))
ax.axis((0, 10, 10, 0))
ax.xaxis.tick_top()
i = 0
for net in net_info:
x1, y1, w1, h1 = record_rect_info[net[0]]
x2, y2, w2, h2 = record_rect_info[net[1]]
x1, y1 = x1 + 0.25*(i-1), y1 + 0.25*(i-1)
x2, y2 = x2 + 0.25*(i-1), y2 + 0.25*(i-1)
plt.scatter(x1 + 0.5*w1, y1 + 0.5*h1, zorder=30, color='C'+str(i))
plt.scatter(x2 + 0.5*w2, y2 + 0.5*h2, zorder=30, color='C'+str(i))
plt.hlines(y1 + 0.5*h1, x1 + 0.5*w1, x2 + 0.5*w2, colors='gray', lw=5, alpha=0.5)
plt.vlines(x2 + 0.5*w2, y1 + 0.5*h1, y2 + 0.5*h2, colors='gray', lw=5, alpha=0.5)
i += 1
plt.show()
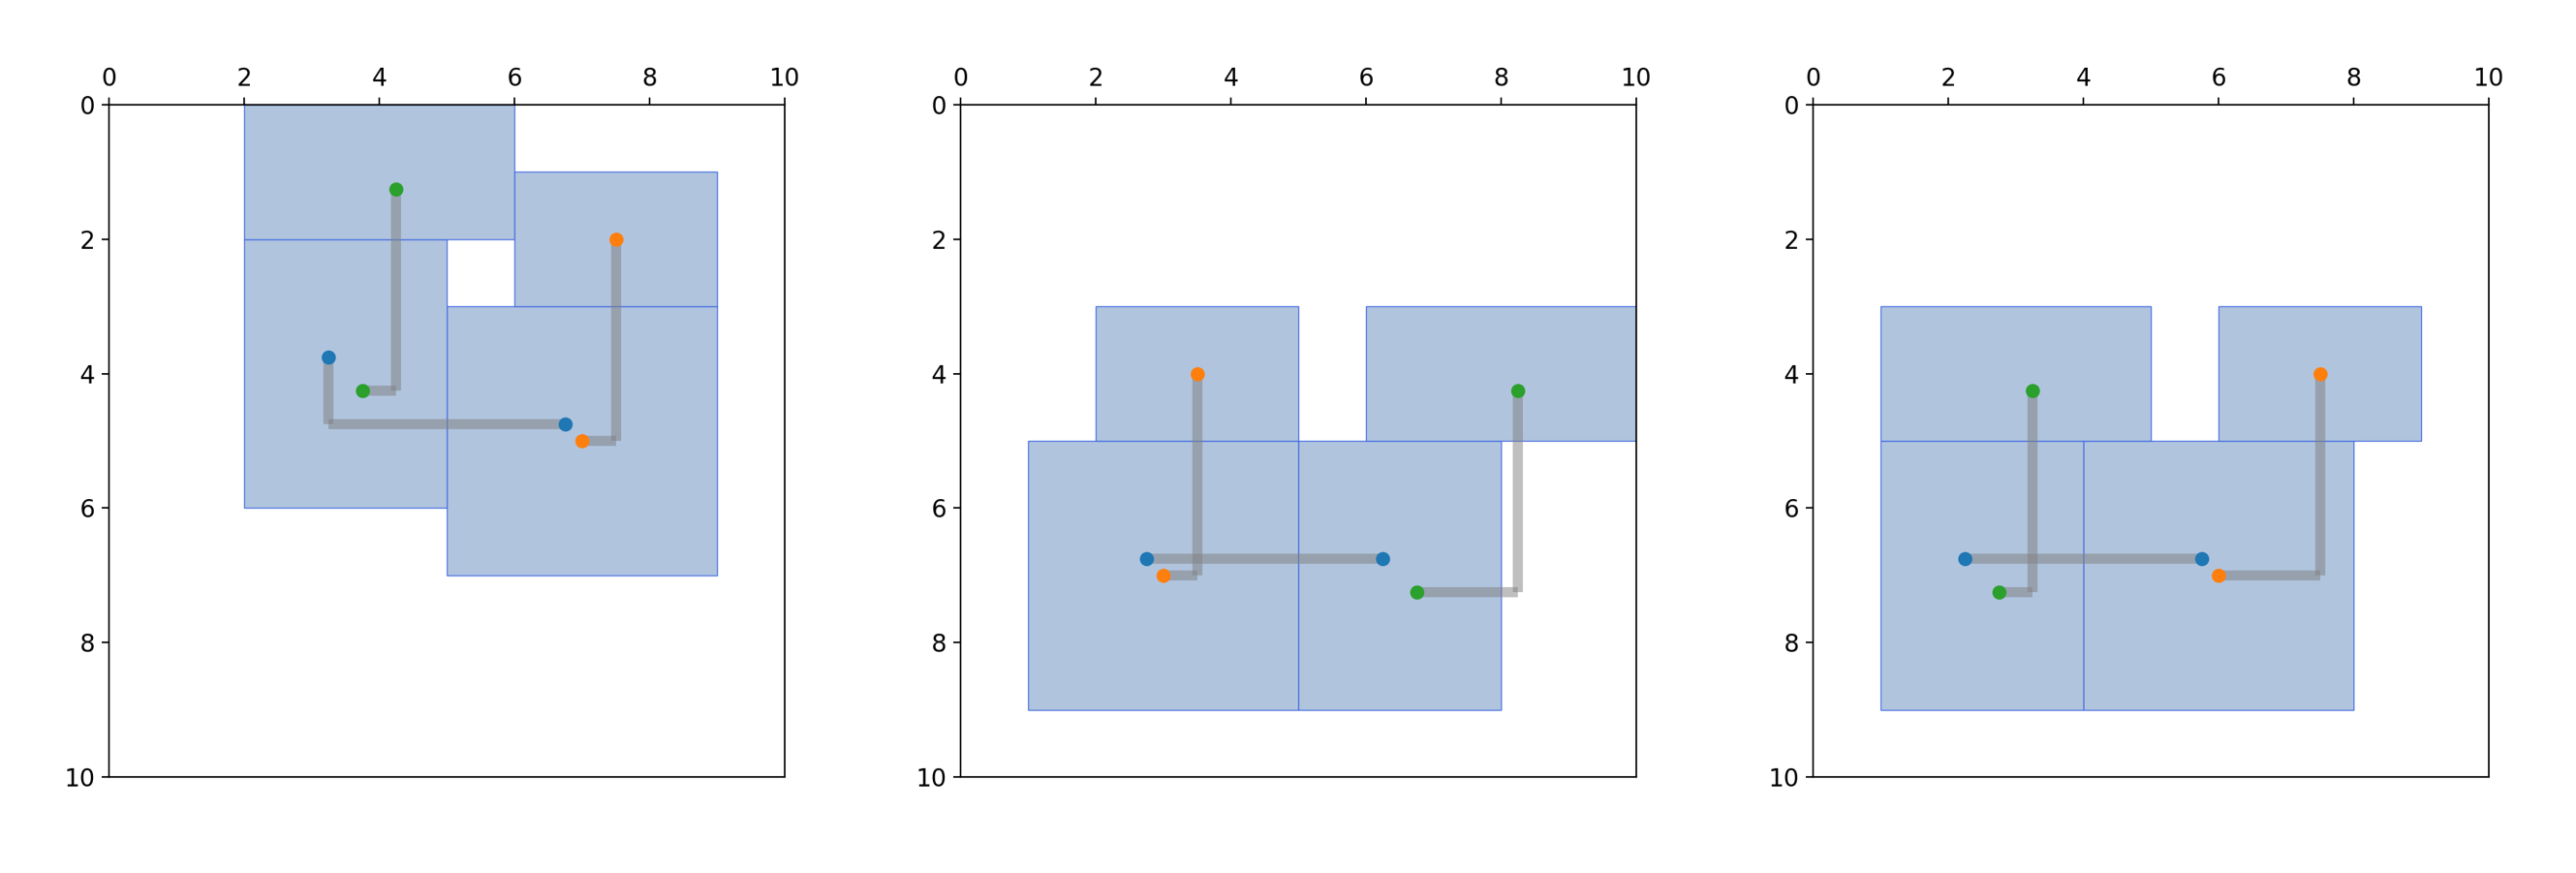
이번에는 record_len_route 변수를 사용해서 임의의 배치에서 정해진 연결 net_info이 가장 짧아지는 배치를
record_rect_info에 저장하도록 했습니다.
아래 그림은 num_episodes를 1000회로 했을 때, 세 번의 결과를 나타냅니다.
세 번 모두 연결 길이가 9입니다.
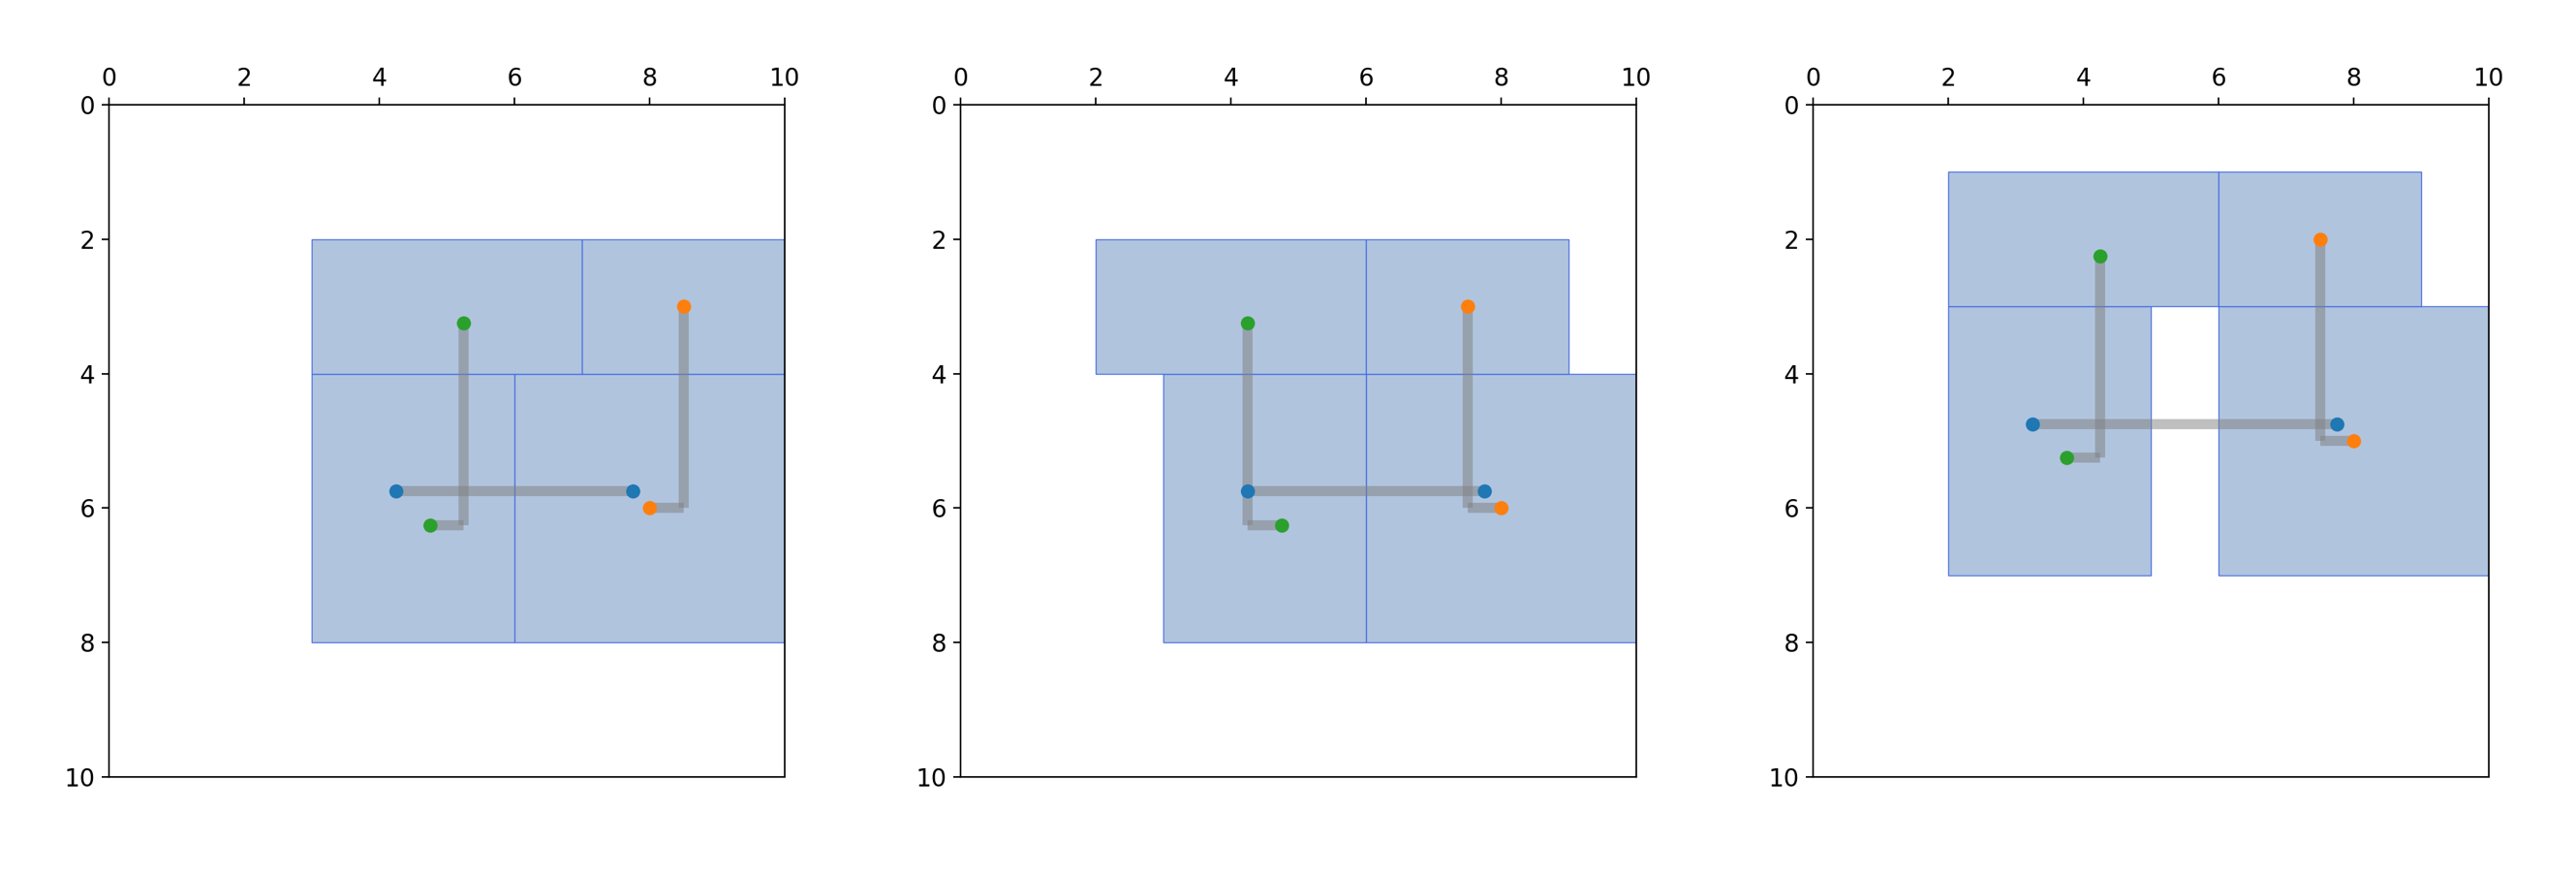
아래 그림은 num_episodes를 30000회로 했을 때, 세 번의 결과를 나타냅니다.
세 번 모두 연결 길이가 8입니다.
이전글/다음글
이전글 : 배치와 연결 (3) - 도형 연결하기