배치와 연결 (2) - 가장 작은 면적을 갖도록 배치하기
이전 페이지에서 특정 평면에서 빈 공간을 찾아 사각형 상자를 배치하는 방법에 대해 소개했습니다.
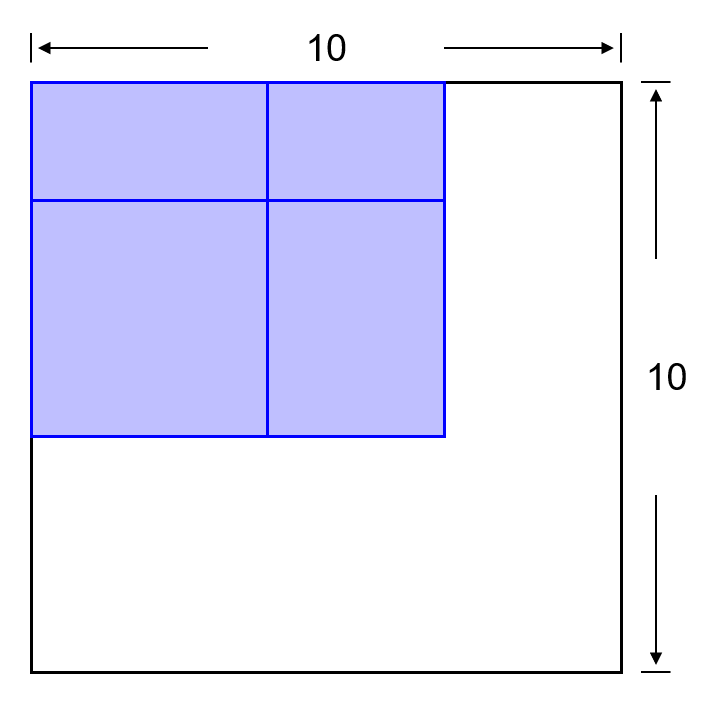
이번에는 네 개의 상자가 작은 면적을 차지하도록 하는 배치를 찾는 과정에 대해 소개합니다.
■ Table of Contents
1) 모듈 임포트 & 함수 정의하기
import numpy as np
import matplotlib.pyplot as plt
import matplotlib.patches as patches


def draw_rect(canvas, rectangle):
    (x, y, w, h) = rectangle
    canvas[y:y+h, x:x+w] = len(rect_info)


def find_place(canvas, rectangle):
    w_rect, h_rect = rectangle[2], rectangle[3]
    options = []
    for i in range(height - h_rect + 1):
        for j in range(width - w_rect + 1):
            if not np.any(canvas[i:i+h_rect, j:j+w_rect]):
                options.append((j, i))
    rand = np.random.randint(len(options))
    return options[rand]
draw_rect(canvas, rectangle) 함수는 2차원 어레이 canvas에 사각형 rectangle을 배치합니다.
find_place(canvas, rectangle) 함수는 2차원 어레이 canvas에 사각형 rectangle을 놓을 수 있는 위치를 찾아서 반환합니다.
2) 변수 지정하기
width, height = 10, 10
new_rect= [[0, 0, 4, 4], [0, 0, 3, 4], [0, 0, 4, 2], [0, 0, 3, 2]]
record_x, record_y = 10, 10
record_rect_info = []
num_episodes = 1000
width, height는 평면 공간의 너비와 높이이고, new_rect는 이 공간에 놓여질 사각형의 (x, y, w, h) 정보입니다.
record_x, record_y는 가장 작은 x, y 위치를 저장합니다.
record_rect_info는 가장 작은 면적을 갖는 사각형 정보를 갖는 리스트입니다.
num_episodes회 동안 네 개의 사각형을 임의로 배치해서 가장 작은 면적을 갖는 위치를 저장하게 됩니다.
3) 가장 작은 면적을 갖는 배치 찾기
for n in range(num_episodes):
  canvas1 = np.zeros((height, width))
  rect_info = []
  for rect in new_rect:
      rect[0], rect[1] = find_place(canvas1, rect)
      rect_info.append(tuple(rect))
      draw_rect(canvas1, rect)

  max_x = max(np.array(rect_info)[:, 0] + np.array(rect_info)[:, 2])
  max_y = max(np.array(rect_info)[:, 1] + np.array(rect_info)[:, 3])
  if max_x <= record_x and max_y <= record_y:
      record_rect_info = rect_info
      record_x, record_y = max_x, max_y
1000회의 에피소드 동안 빈 자리를 찾아 임의로 사각형을 배치하고, x, y 위치의 최대값이 가장 작은 배치인 경우
이 배치를 record_rect_info에 저장합니다.
4) Matplotlib 시각화하기
plt.style.use('default')
plt.rcParams['figure.figsize'] = (6, 6)
plt.rcParams['font.size'] = 12

fig, ax = plt.subplots()
for (x, y, w, h) in record_rect_info:
    ax.add_patch(
        patches.Rectangle(
            (x, y), w, h,
            edgecolor='royalblue',
            facecolor='lightsteelblue',
            linewidth=0.5,
            fill=True))

ax.axis((0, 10, 10, 0))
ax.xaxis.tick_top()
plt.show()
위 코드는 네 개의 상자들의 정보를 갖는 리스트 record_rect_info를 Matplotlib를 사용해서 시각화합니다.
Matplotlib patches 모듈을 사용해서 도형 시각화하기 페이지를 참고하세요.
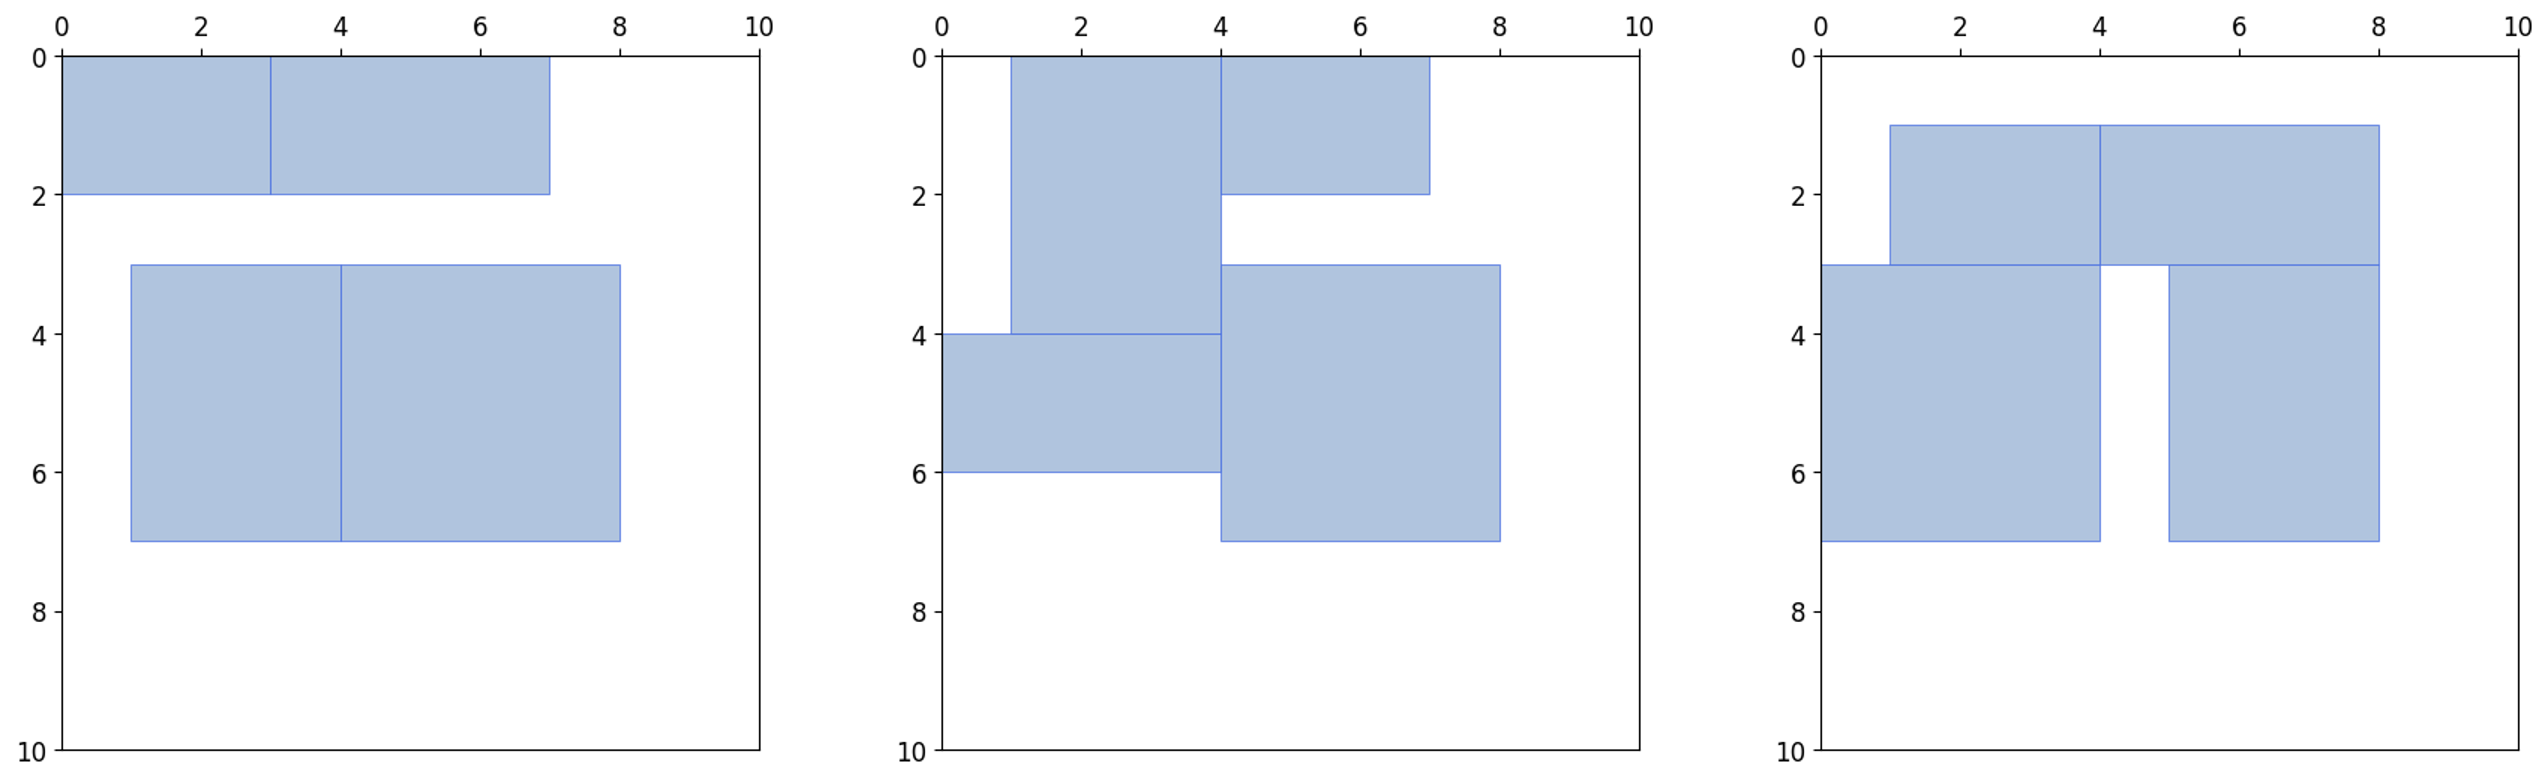
아래 그림은 num_episodes를 1000회로 했을 때, 세 번의 결과를 나타냅니다.
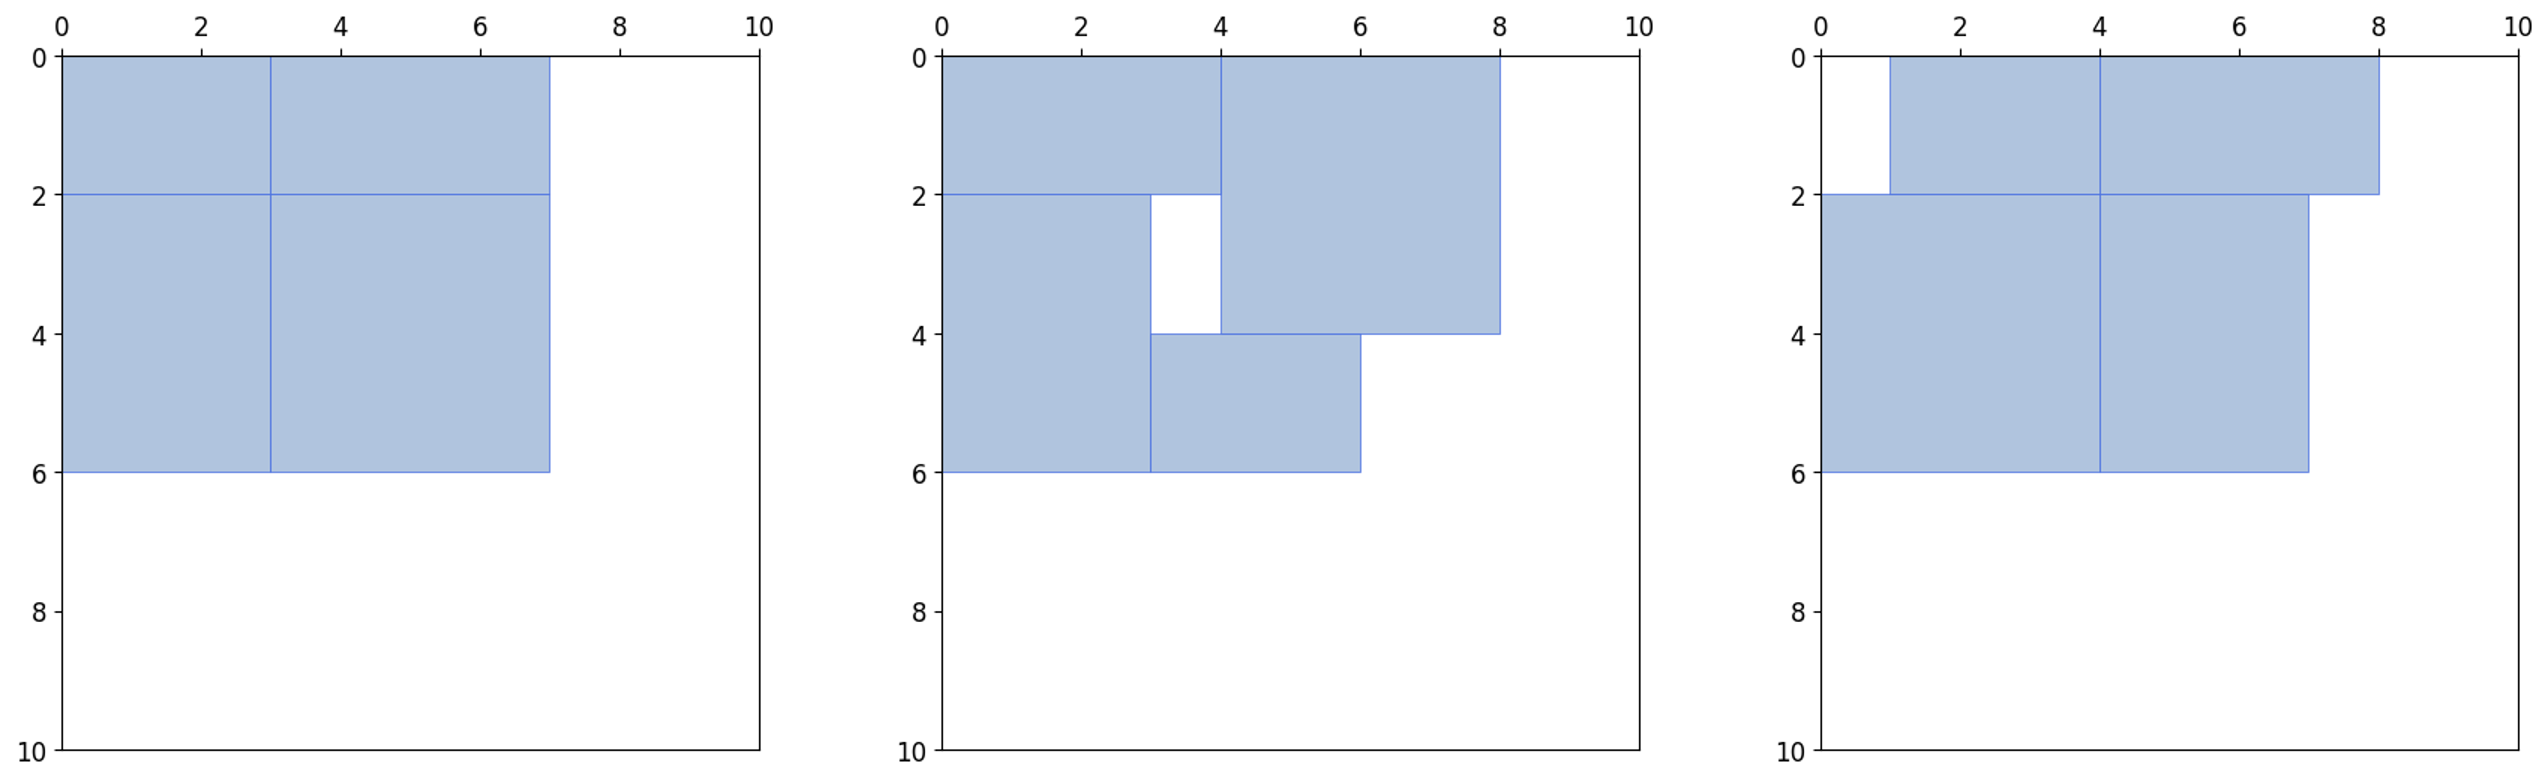
아래 그림은 num_episodes를 30000회로 했을 때, 세 번의 결과를 나타냅니다.
전체 코드는 아래와 같습니다.
import numpy as np
import matplotlib.pyplot as plt
import matplotlib.patches as patches


def draw_rect(canvas, rectangle):
  (x, y, w, h) = rectangle
  canvas[y:y+h, x:x+w] = len(rect_info)


def find_place(canvas, rectangle):
  w_rect, h_rect = rectangle[2], rectangle[3]
  options = []
  for i in range(height - h_rect + 1):
      for j in range(width - w_rect + 1):
          if not np.any(canvas[i:i+h_rect, j:j+w_rect]):
              options.append((j, i))
  rand = np.random.randint(len(options))
  return options[rand]


width, height = 10, 10
new_rect= [[0, 0, 4, 4], [0, 0, 3, 4], [0, 0, 4, 2], [0, 0, 3, 2]]
record_x, record_y = 10, 10
record_rect_info = []
num_episodes = 1000

for n in range(num_episodes):
  canvas1 = np.zeros((height, width))
  rect_info = []
  for rect in new_rect:
      rect[0], rect[1] = find_place(canvas1, rect)
      rect_info.append(tuple(rect))
      draw_rect(canvas1, rect)

  max_x = max(np.array(rect_info)[:, 0] + np.array(rect_info)[:, 2])
  max_y = max(np.array(rect_info)[:, 1] + np.array(rect_info)[:, 3])
  if max_x <= record_x and max_y <= record_y:
      record_rect_info = rect_info
      record_x, record_y = max_x, max_y


plt.style.use('default')
plt.rcParams['figure.figsize'] = (6, 6)
plt.rcParams['font.size'] = 12

fig, ax = plt.subplots()
for (x, y, w, h) in record_rect_info:
    ax.add_patch(
        patches.Rectangle(
            (x, y), w, h,
            edgecolor='royalblue',
            facecolor='lightsteelblue',
            linewidth=0.5,
            fill=True))

ax.axis((0, 10, 10, 0))
ax.xaxis.tick_top()
plt.show()